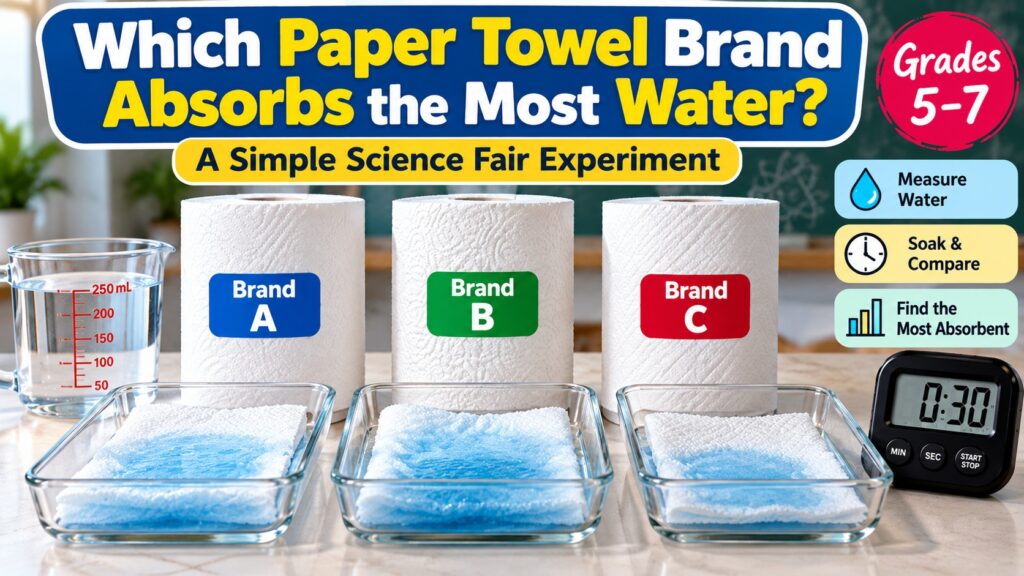

Subject: Physical Science | Grades: 5–7 | Time: 45–60 minutes | Difficulty: Easy
Which Paper Towel Brand Absorbs the Most Water?
Which paper towel is the most absorbent? Some brands advertise extra thickness, stronger fibers, or better absorption. But do these claims hold up in a science experiment?
This easy science fair project lets students compare three paper towel brands using measured quantities of water. It is suitable for elementary and middle school science fairs in the United States and Canada.
Quick AnswerThere is no single paper towel brand that can be declared the most absorbent without testing specific products under the same conditions.
To find out, compare equal-sized samples from three brands. Add a measured amount of water, allow the towels to absorb it for the same length of time, and measure how much water remains. Repeat the experiment three times per brand and calculate the average amount absorbed.
What Is the Purpose of This Experiment?
The objective is to determine which of three paper towel brands absorbs the greatest volume of water under controlled conditions.
Students will practice measuring liquids, controlling variables, recording numerical results, and using evidence to support a scientific conclusion.
Also Read : Does Salt Make Ice Melt Faster?
Science Fair Research Question
Which paper towel brand absorbs the most water when equal-sized samples are tested using the same procedure?
This question can be answered experimentally because the amount of absorbed water can be measured and compared.
Hypothesis
Example HypothesisIf equal-sized samples from three paper towel brands are tested, then Brand B will absorb the greatest amount of water because its fiber structure may retain more liquid.
This is only an example prediction. Students should choose their own hypothesis before collecting data.
Materials Required
- Three different paper towel brands
- Scissors and a ruler
- Measuring cup or graduated cylinder
- Water
- Three identical shallow trays or bowls
- One additional container for collecting leftover water
- Timer or stopwatch
- Waterproof labels or marker
- Notebook and pencil
- Adult supervision when using scissors
Optional: A digital kitchen scale can be used for a separate experiment comparing the mass of water absorbed.
What Are the Variables?
| Variable | Explanation |
|---|---|
| Independent variable | Paper towel brand |
| Dependent variable | Volume of water absorbed, measured in milliliters |
| Controlled variables | Sample size, starting water volume, soaking time, draining time, tray type, and testing procedure |
How to Perform the Paper Towel Absorption Experiment
Step 1: Prepare Equal-Sized Samples
Choose three paper towel brands and label them A, B, and C.
Cut three 10 cm × 10 cm squares from each brand, giving nine samples in total.
Use the full thickness of each product as sold, without separating its layers. This compares equal areas of the commercial products, rather than equal numbers of paper layers.
Step 2: Measure the Water
Pour exactly 100 mL of room-temperature water into an identical shallow tray for each test.
Use the same water volume and tray dimensions for every trial.
Step 3: Test Brand A
- Place one Brand A sample flat into the tray containing 100 mL of water.
- Start the stopwatch immediately.
- Allow the towel to absorb water for 30 seconds.
- Using two corners, lift the towel carefully without squeezing it.
- Hold it above the original tray for exactly 10 seconds to allow free water to drip back.
- Set the towel aside on a separate surface.
- Carefully pour the remaining tray water into a graduated cylinder and record its volume.
Use the same lifting and pouring technique for all trials. If a sample tears or water spills outside the tray, discard that trial and repeat it.
Step 4: Test Brands B and C
Repeat the procedure using a fresh sample from Brand B and then Brand C.
Make sure that the water volume, soaking time, draining time, and sample size are identical.
Step 5: Repeat Each Test
Complete three trials for each brand, using fresh samples and fresh water every time.
For better precision, measure and record the volume remaining in the tray before pouring it into the graduated cylinder, using a consistent transfer method. A small amount of water may remain on the tray walls, so use identical equipment and technique.
Important experimental limitationThis method estimates water retained by the towel from the difference between starting and remaining water. Some water can be lost during handling or transfer. For a more precise investigation, weigh each dry towel and then weigh it again after the same soaking and draining procedure.
How to Calculate Water Absorption
Absorption FormulaEstimated water absorbed (mL) = Starting water volume (mL) − Remaining water volume (mL)
For example, if a tray begins with 100 mL of water and 68 mL remains after testing, the estimated amount absorbed is 32 mL.
This is an illustrative calculation, not an actual experimental result.
Paper Towel Absorption Results Table
Use this blank observation table to record actual measurements.
| Brand | Trial 1 (mL) | Trial 2 (mL) | Trial 3 (mL) | Average (mL) |
|---|---|---|---|---|
| Brand A | ____ | ____ | ____ | ____ |
| Brand B | ____ | ____ | ____ | ____ |
| Brand C | ____ | ____ | ____ | ____ |
Enter the estimated volume absorbed in each trial, not the volume left in the tray.
Calculate Average Absorption
For each brand, add the absorption values from all three trials and divide by three.
For example, if a brand absorbed 30 mL, 33 mL, and 36 mL in three hypothetical trials, its average would be 33 mL.
Do not use example numbers as actual science fair findings.
How to Create a Science Fair Graph
A bar graph is suitable for comparing the three paper towel brands.
- X-axis: Paper towel brand
- Y-axis: Average water absorbed (mL)
- Title: Paper Towel Water Absorption Comparison
- Bars: One bar for each brand
The tallest bar represents the brand with the highest measured average absorption.
If the results are very close, students should examine the differences between trials before declaring a clear winner.
Why Do Paper Towels Absorb Water?
Paper towels contain networks of cellulose fibers. These fibers create tiny spaces and channels that allow water to move into the towel.
Two important scientific concepts explain the process:
1. Adhesion
Adhesion is the attraction between water molecules and another material, such as cellulose fibers.
Water interacts with the fiber surfaces, helping the liquid spread into the towel.
2. Capillary Action
Capillary action occurs when liquid moves through narrow spaces because of interactions among the liquid, surrounding surfaces, and surface tension.
Paper towels contain many small gaps between fibers, allowing water to spread through their structure.
3. Fiber Structure and Thickness
Absorption can also depend on fiber arrangement, porosity, sheet thickness, and manufacturing processes.
A thicker towel does not automatically absorb more water per gram of material. Different products may perform differently depending on how absorbency is measured.
What Makes This a Fair Test?
A fair test changes only the independent variable while keeping other important conditions the same.
| Possible Problem | How to Prevent It |
|---|---|
| Different towel sizes | Cut identical 10 × 10 cm samples |
| Different water amounts | Start with 100 mL every time |
| Unequal soaking times | Use a 30-second timer |
| Squeezing one sample | Lift every sample without squeezing |
| Different draining times | Drain every sample for 10 seconds |
| Water spilling during transfer | Pour slowly and repeat invalid trials |
How to Write the Science Fair Conclusion
Student Conclusion Template“My experiment investigated which paper towel brand absorbed the most water. I tested three brands using equal-sized samples and the same amount of water. Brand _____ had the highest average absorption of _____ mL. Brand _____ had the lowest average absorption of _____ mL. These results [supported/did not support] my hypothesis. One possible source of error was _____. Next time, I would improve _____.”
Use actual measurements to complete the conclusion. If the differences are small or the results vary widely between trials, explain that the experiment did not establish a clear winner.
How to Make This Project More Advanced
Older students can extend the investigation by measuring additional properties:
- Absorption per gram: Compare water absorbed relative to the dry mass of each sample.
- Absorption speed: Measure how quickly each towel takes up a fixed amount of water.
- Cost efficiency: Compare the price per unit of water absorbed.
- Wet strength: Investigate how much force wet paper towels can withstand.
- Reusable alternatives: Compare paper towels with washable cloths using a clearly defined test.
These extensions should be conducted as separate investigations with their own controlled variables.
How to Present This Experiment at a Science Fair
Students can organize their science fair display board into the following sections:
- Research question
- Background research
- Hypothesis
- Variables
- Materials and methods
- Photographs of the experiment
- Observation table
- Bar graph
- Conclusion and limitations
- References
Students should use their own photographs and results, rather than presenting illustrative images as experimental evidence.
More Science Fair Projects for Grades 5–7
Explore additional science fair resources on our website:
- 100 Science Fair Ideas for 7th Grade
- Science Fair Project Ideas and Printable Resources
- Science Fair Ideas for Middle School Students
- Easy Science Experiments for 6th–9th Graders
Educational References
For additional information about scientific investigations, experimental design, and materials science, visit:
- Science Buddies — Science Fair Project Guide
- American Chemical Society — Education Resources
- Khan Academy — Science Resources
Editorial note: This article provides an educational testing method. No specific paper towel brand has been tested or endorsed by this website in this guide. Students should conduct their own trials and record original observations.
Key Takeaways
- The most absorbent paper towel must be determined by testing actual products.
- Use equal-sized samples from three brands.
- Keep soaking time and water volume consistent.
- Complete at least three trials per brand.
- Calculate average water absorption and create a bar graph.
- Explain possible errors and limitations in the conclusion.
Suitable for: Grades 5–7 science fair projects in the United States and Canada.