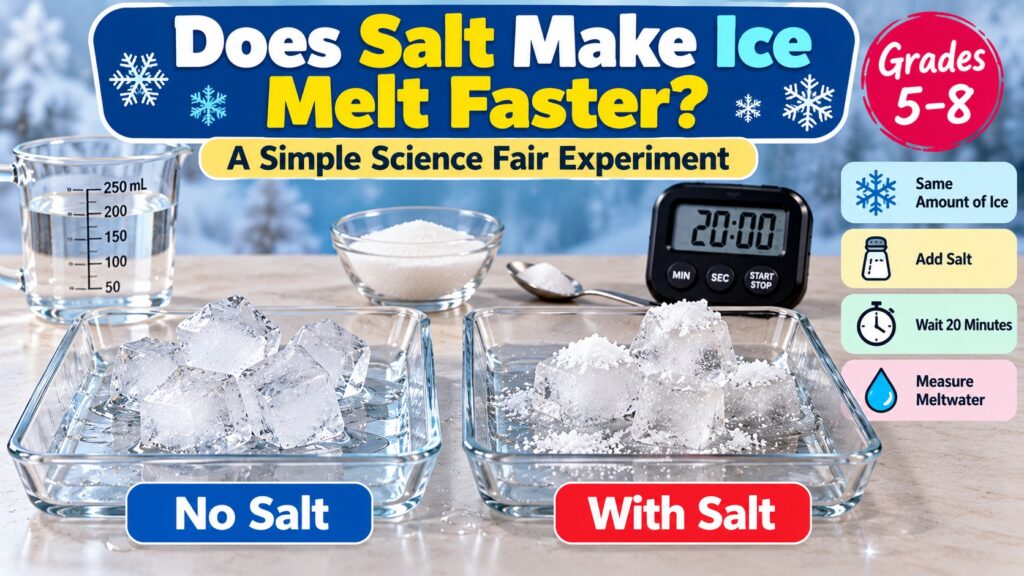

Subject: Physical Science and Chemistry | Grades: 5–8 | Time: 30–45 minutes | Difficulty: Easy
Does Salt Make Ice Melt Faster? Science Fair Experiment
Have you ever wondered why road crews spread salt on icy roads during winter? Salt changes the freezing behavior of water, which helps explain why it can make ice melt under certain conditions.
In this science fair experiment, students compare plain ice with ice treated using table salt. They measure the amount of melted water produced over a fixed period and learn about freezing point depression.
To investigate this effect, compare equal masses of ice with and without salt under identical conditions. Measure the meltwater collected after the same amount of time. The results will show whether salt increased melting in your experiment.
What Is the Aim of This Experiment?
The aim is to investigate whether adding table salt changes the amount of ice that melts during a fixed period.
Students will practice scientific observation, controlling variables, measuring liquid volume, repeating trials, and interpreting results.
Science Fair Research Question
Does adding 5 grams of table salt increase the amount of ice melted over 20 minutes compared with ice without salt?
This is a testable question because students can compare two conditions and measure the results.
Hypothesis
The hypothesis is a prediction. Students should use their observations to decide whether the evidence supports it.
Materials Required
- Ice cubes made from the same batch of water
- Table salt
- Two identical shallow trays
- Digital kitchen scale
- Measuring spoon or small container for salt
- Graduated cylinder or measuring cup
- Timer or stopwatch
- Room thermometer
- Notebook and pencil
- Paper towels for cleaning spills
- Do not handle ice for long periods with bare hands.
- Do not taste the saltwater or ice used in the experiment.
- Clean up spills immediately to prevent slipping.
- Keep electronic scales away from water.
- Wash and dry hands after the experiment.
Variables in the Salt and Ice Experiment
| Variable Type | What Is Measured or Changed? |
|---|---|
| Independent variable | Presence or absence of 5 grams of table salt |
| Dependent variable | Volume of liquid meltwater collected after 20 minutes |
| Controlled variables | Initial ice mass, ice cube size, tray type, room temperature, observation time, and starting conditions |
Step-by-Step Salt and Ice Experiment
Step 1: Prepare Equal Amounts of Ice
Use a digital kitchen scale to prepare two groups of ice weighing 100 grams each.
Choose ice cubes of similar size from the same freezer batch. This helps reduce differences in surface area and starting temperature.
Step 2: Prepare the Test Trays
Place each group of ice in an identical shallow tray.
Label one tray Control — No Salt and the other Salt Treatment.
Position both trays side by side in the same room, away from direct sunlight, heaters, or air-conditioning vents.
Step 3: Add the Salt
Measure exactly 5 grams of table salt.
Sprinkle the salt evenly over the ice in the Salt Treatment tray.
Do not add salt to the control tray.
Step 4: Start the Timer
Start a stopwatch immediately after adding the salt.
Allow both trays to remain undisturbed for 20 minutes.
Record the room temperature and make observations at 5-minute intervals.
Step 5: Measure the Meltwater
At the end of 20 minutes, carefully separate the remaining solid ice from the liquid in each tray.
Pour the liquid from each tray into a graduated cylinder and measure its volume in milliliters.
Use the same collection method for both trays. Avoid transferring ice fragments into the cylinder.
Record the liquid volume for each condition. This is an approximate measurement of melting because some liquid may remain on the ice or tray, and the salted liquid has different properties from pure water.
Step 6: Repeat Three Times
Repeat the entire experiment three times using fresh ice from the same batch and newly measured salt.
Repetitions help identify inconsistent measurements and make the results more reliable.
Salt and Ice Experiment Results Table
Record your actual measurements below. The table is intentionally blank because the results must come from your experiment.
| Trial | No Salt (mL) | With Salt (mL) | Difference (mL) |
|---|---|---|---|
| Trial 1 | _____ | _____ | _____ |
| Trial 2 | _____ | _____ | _____ |
| Trial 3 | _____ | _____ | _____ |
| Average | _____ | _____ | _____ |
How to Calculate the Average Meltwater Volume
For example, if a set of hypothetical measurements is 18 mL, 21 mL, and 24 mL, the average would be 21 mL.
These numbers demonstrate the calculation only and are not actual experiment results.
How to Create a Science Fair Graph
Use a bar graph to compare the average amount of meltwater collected from salted and unsalted ice.
- X-axis: Ice treatment (No Salt and With Salt)
- Y-axis: Average collected liquid volume (mL)
- Title: Effect of Salt on Ice Melting
- Bars: One for the control and one for the salt treatment
A higher bar indicates more liquid was collected during the observation period. Discuss possible measurement errors before concluding that one condition melted more ice.
Why Does Salt Affect Ice Melting?
Pure water freezes at approximately 0°C (32°F) under normal atmospheric pressure.
When table salt dissolves in liquid water, it separates into sodium and chloride ions. These dissolved particles lower the freezing point of the solution.
This effect is called freezing point depression.
Ice commonly has a thin layer of liquid water on its surface. When salt dissolves in this layer, the resulting solution may remain liquid below the normal freezing point of pure water.
Salt does not generate heat. Melting requires energy from the surroundings, and the process may cool the remaining ice-water mixture.
Why Do Roads Become Less Icy When Salt Is Applied?
Road maintenance teams in parts of the United States and Canada use salt to help prevent or reduce ice accumulation.
Salt is most effective under suitable temperature and moisture conditions. Its performance decreases in very cold weather, and road agencies may use alternative treatments depending on local conditions.
Road salt also has environmental consequences. Excess chloride can enter soil, streams, and lakes, potentially affecting freshwater ecosystems.
Common Mistakes That Can Affect Results
| Possible Error | How to Prevent It |
|---|---|
| Different ice quantities | Measure 100 grams for each tray |
| Different ice cube sizes | Use cubes from the same mold |
| Unequal room conditions | Keep trays side by side |
| Different testing times | Use the same 20-minute period |
| Spilling liquid during collection | Transfer slowly and consistently |
| Including ice fragments in the measurement | Separate solid ice before measuring |
How to Write the Science Fair Conclusion
Explain what the data show, even if the result differs from your original prediction.
How Can Students Extend This Experiment?
After completing the basic experiment, students can explore additional research questions:
- Does the amount of salt affect the melting rate?
- How does table salt compare with calcium chloride?
- Does crushed ice respond differently from large ice cubes?
- How does room temperature affect the experiment?
- Does sugar affect ice melting in the same way as salt?
Each extension should be planned as a separate controlled experiment. Chemical deicers should only be investigated with appropriate adult supervision and safety guidance.
How to Present the Project at a Science Fair
Students can organize a science fair display board into these sections:
- Project title
- Research question
- Background research
- Hypothesis
- Independent and dependent variables
- Materials and procedure
- Photographs of the actual experiment
- Results table and graph
- Conclusion and limitations
- References
More Science Fair Experiments for Students
Explore additional science fair resources from 1000ScienceFairProjects.com:
- 100 Science Fair Ideas for 7th Grade
- Science Fair Ideas for Middle School Students
- Science Fair Project Ideas PDF
- Easy Science Experiments for 6th–9th Graders
Related experiments: Read our guides on water temperature and sugar dissolving and paper towel water absorption.
Educational References
- Science Buddies — Science Fair Project Guide
- American Chemical Society — Chemistry Education
- US EPA — Freshwater Salinization Resources
Editorial note: This educational experiment describes a suggested method. The example measurements are illustrative only. Students should conduct their own experiments, record actual data, and follow school laboratory safety rules.
Key Takeaways
- Salt lowers the freezing point of water.
- Salt can promote ice melting under suitable conditions.
- Use equal ice masses and identical trays for a fair comparison.
- Measure the liquid collected after the same time interval.
- Repeat the experiment at least three times.
- Use actual measurements to support the conclusion.
Best suited for: Grades 5–8 science fair projects, winter STEM activities, and physical science classroom investigations in the United States and Canada.