
Subject: Biology and Plant Science | Grades: 6–8 | Duration: 14–21 days | Difficulty: Moderate
Does Light Color Affect Plant Growth? Science Experiment
Can changing the color of light change how plants grow? Plants need light for photosynthesis, but different wavelengths of light can influence their development in different ways.
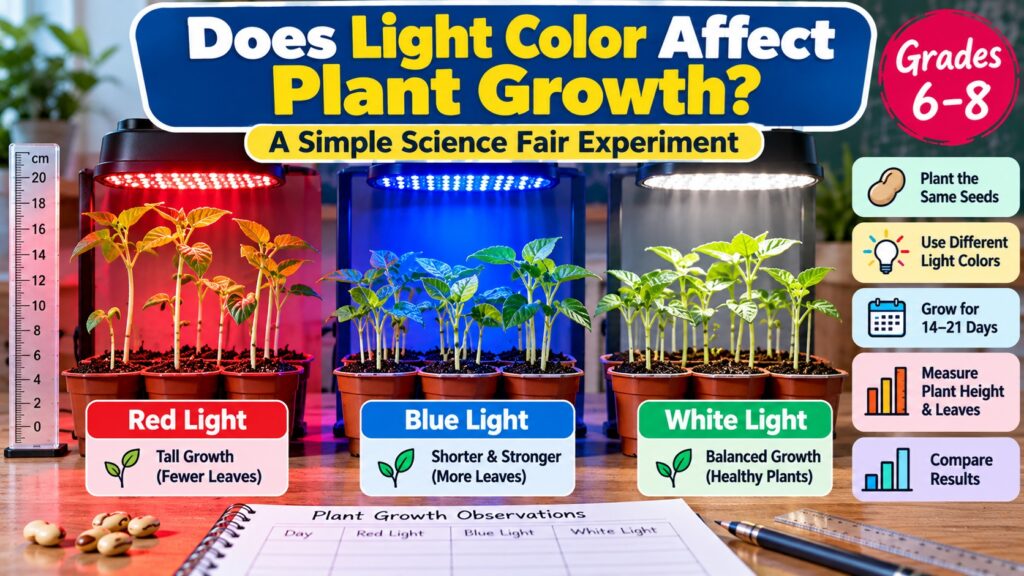
This science fair experiment investigates how red, blue, and white LED light affect bean seedlings. Students measure plant height, count leaves, and compare growth patterns over two to three weeks.
To test the effect, grow identical seedlings under red, blue, and white LED lights while keeping watering, soil, temperature, light duration, and light intensity as consistent as possible. Compare height, leaf number, and appearance over 14–21 days.
What Is the Aim of This Experiment?
The aim is to determine whether the color of LED light affects the growth of bean seedlings under controlled conditions.
Students will learn about photosynthesis, experimental variables, data collection, graphing, and biological variation.
Science Fair Research Question
How does red, blue, or white LED light affect the average height and leaf development of bean seedlings over 21 days?
Hypothesis
This is a testable prediction, not a guaranteed outcome. Growth also depends on light intensity, seed variety, water availability, and environmental conditions.
Materials Required
- 15 bean seeds of the same variety and seed lot
- 15 identical small plant pots with drainage holes
- Potting mix from the same bag
- Red, blue, and white LED grow lights
- Three separate growing areas or light-blocking dividers
- Ruler marked in millimeters
- Measuring cup for watering
- Timer for controlling the daily light period
- Thermometer
- Labels and notebook
- Optional: Light meter suitable for plant lighting
- Use low-voltage, commercially certified LED lights.
- Keep electrical plugs and connections away from water.
- Do not use ultraviolet lamps or high-heat bulbs.
- Follow the light manufacturer’s installation instructions.
- Ask an adult to help arrange the lighting setup.
- Wash hands after handling potting mix.
Variables in the Plant Growth Experiment
| Variable Type | What It Means |
|---|---|
| Independent variable | LED light color: red, blue, or white |
| Dependent variables | Seedling height, number of true leaves, and visible plant development |
| Controlled variables | Seed variety, soil quantity, pot size, watering, light duration, temperature, and approximate light intensity |
Step-by-Step Light Color and Plant Growth Experiment
Step 1: Prepare the Pots
Fill 15 identical pots with equal amounts of the same potting mix. Label five pots Red, five Blue, and five White.
Plant one bean seed in each pot at the same depth, following the seed packet instructions.
Step 2: Germinate the Seeds
Place all pots together under the same suitable germination conditions. Keep the soil evenly moist but not waterlogged.
When seedlings emerge, select healthy plants of similar initial size for the three treatment groups. Record any seeds that failed to germinate.
For a stronger experiment, begin with extra seeds, then randomly assign 15 similarly developed seedlings to the three groups.
Step 3: Arrange the LED Lights
Place five seedlings under each light treatment:
- Group A: Red LED light
- Group B: Blue LED light
- Group C: White LED light
Use dividers to prevent light from one group reaching another. Ensure that the dividers allow sufficient airflow.
Different LED colors can produce different light intensities even when the lamps have the same electrical wattage. For a scientifically rigorous comparison, match photosynthetic photon flux density (PPFD) using an appropriate sensor.
If such equipment is unavailable, record the lamp specifications and distances, and explain that unequal light intensity is a limitation of the experiment.
Step 4: Set the Daily Lighting Schedule
Provide each group with approximately 14 hours of light and 10 hours of darkness every day.
Use a timer so all groups receive the same lighting duration.
Step 5: Water the Plants Consistently
Check soil moisture daily and use the same watering method for each group.
Water according to plant needs rather than allowing one group to become dry or waterlogged.
Record the amount of water supplied to each pot.
Step 6: Measure Seedling Growth
Measure plant height from the soil surface to the highest growing point, using the same method for every plant.
Record measurements on Days 1, 4, 7, 10, 14, 17, and 21.
Count true leaves separately from the initial seed leaves.
Step 7: Calculate Group Averages
For each light treatment, calculate the average height of the five plants.
Do not use only the tallest seedling to represent the group.
Plant Growth Observation Table
Record actual measurements in centimeters. Each entry should be the average height of the plants in that group.
| Day | Red Light (cm) | Blue Light (cm) | White Light (cm) |
|---|---|---|---|
| Day 1 | ____ | ____ | ____ |
| Day 4 | ____ | ____ | ____ |
| Day 7 | ____ | ____ | ____ |
| Day 10 | ____ | ____ | ____ |
| Day 14 | ____ | ____ | ____ |
| Day 17 | ____ | ____ | ____ |
| Day 21 | ____ | ____ | ____ |
Final Plant Development Comparison
| Light Color | Average Final Height | Average True Leaves | Observations |
|---|---|---|---|
| Red | ____ cm | ____ | ________ |
| Blue | ____ cm | ____ | ________ |
| White | ____ cm | ____ | ________ |
How to Calculate Average Plant Height
For example, if five hypothetical plants measure 12, 13, 11, 14, and 10 cm, their average height is 12 cm.
These values illustrate the calculation and are not experimental results.
How to Create a Science Fair Graph
Use a line graph to show plant growth over time.
- X-axis: Day of experiment
- Y-axis: Average plant height in centimeters
- Lines: Red, blue, and white light treatments
- Title: Effect of Light Color on Bean Seedling Growth
A separate bar graph can compare the average number of true leaves after 21 days.
Why Does Light Color Affect Plant Growth?
Plants use light energy to convert carbon dioxide and water into sugars during photosynthesis. Chlorophyll absorbs light strongly in portions of the red and blue regions of the visible spectrum.
Plants also contain photoreceptors that respond to light signals and influence stem elongation, leaf development, and other growth processes.
Red Light
Red light can support photosynthesis and influences plant development through phytochrome signaling. Its effects depend on intensity, duration, species, and the presence of other wavelengths.
Blue Light
Blue light contributes to photosynthesis and affects plant shape, leaf expansion, stomatal behavior, and stem development.
White Light
White light contains a mixture of visible wavelengths. Its exact spectrum depends on the LED design.
Because plants respond to both light quality and quantity, no single color can be assumed to produce the best growth in every species or experimental setup.
Does the Tallest Plant Mean the Healthiest Plant?
No. Plant height alone does not determine plant health.
Some seedlings grow taller when light conditions encourage stem elongation. A tall, thin seedling may be less robust than a shorter plant with healthy leaves and a sturdy stem.
That is why this experiment records both height and leaf development.
Common Mistakes That Can Affect Results
| Possible Problem | How to Reduce It |
|---|---|
| Different seed varieties | Use seeds from the same variety and packet |
| Unequal light intensity | Measure PPFD where possible and record limitations |
| Light leaking between groups | Use suitable light-blocking dividers |
| Different watering | Use consistent moisture checks and record amounts |
| Different room temperatures | Monitor temperatures near each group |
| Measuring plants differently | Use one consistent height measurement method |
How to Write the Science Fair Conclusion
How Can Students Extend This Experiment?
- Does light duration affect seedling growth?
- How does light intensity affect plant height?
- Do different plant species respond differently to blue light?
- Does the distance from an LED lamp affect growth?
- How does a mixture of red and blue light compare with white light?
Each extension should be conducted as a separate experiment with clearly controlled variables.
How to Present the Project at a Science Fair
- Project title and research question
- Background research on photosynthesis
- Hypothesis
- Variables and experimental design
- Photographs of the growing setup
- Plant height observation table
- Growth line graph
- Leaf development comparison
- Conclusion and limitations
- Scientific references
More Science Fair Experiments
- Water Temperature and Sugar Dissolving Experiment
- Which Paper Towel Brand Absorbs the Most Water?
- Does Salt Make Ice Melt Faster?
- Which Type of Soil Holds the Most Water?
- 100 Science Fair Ideas for 7th Grade
Educational References
- University of Minnesota Extension — Gardening and Plant Science
- Science Buddies — Science Fair Project Guide
- Khan Academy — Biology Resources
Editorial note: This is a proposed classroom investigation, not a report of a completed experiment. Example measurements are illustrative only. Students should collect their own data and follow their school science fair requirements.
Key Takeaways
- Light color can influence plant growth and development.
- Compare red, blue, and white LED treatments.
- Use at least five plants per treatment.
- Keep watering, temperature, and light duration consistent.
- Measure height and leaf development over 21 days.
- Record actual results and discuss light intensity limitations.
Suitable for: Grades 6–8 biology, plant science, and STEM investigations in the United States and Canada.