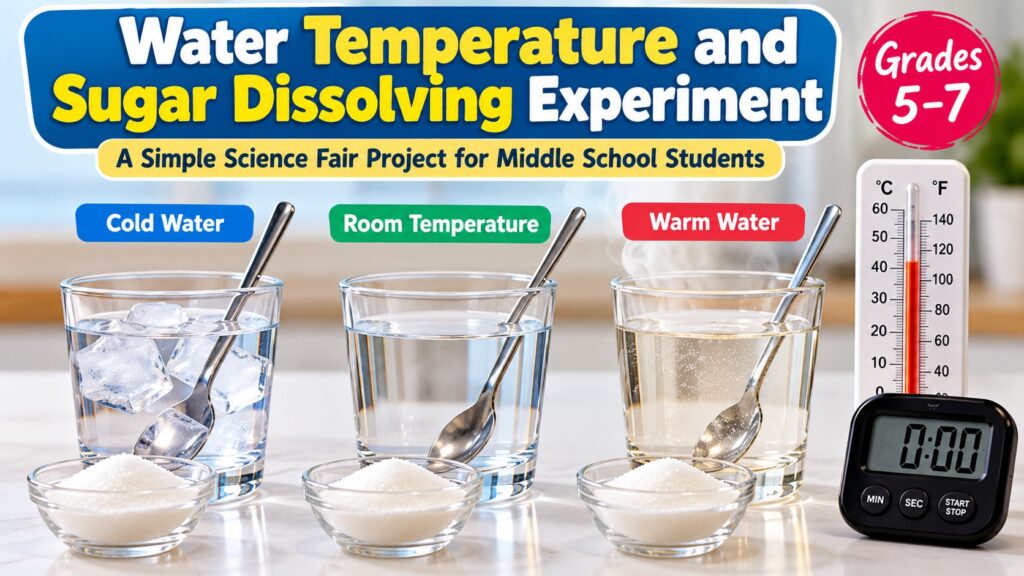

Subject: Chemistry | Grades: 5–7 | Time: 30–45 minutes | Difficulty: Easy
Water Temperature and Sugar Dissolving Experiment
Does sugar dissolve faster in hot water or cold water? This simple science fair experiment helps students investigate how water temperature affects the time required for sugar to dissolve. Using everyday household materials, students can collect measurements, compare results, and create a scientific graph.
Quick Answer:Sugar generally dissolves faster in warmer water than in colder water when the amount of sugar, water volume, stirring method, and other conditions are kept the same.
To test this, add equal amounts of sugar to three cups containing cold, room-temperature, and warm water. Measure how long the sugar takes to disappear completely while stirring each sample in the same way. Repeat the test to check whether your results are consistent.
What Is the Aim of This Science Experiment?
The aim is to determine whether changing water temperature changes the speed at which granulated sugar dissolves.
This experiment is suitable for students preparing a 6th grade science fair project, a middle school STEM assignment, or a classroom investigation in the United States or Canada.
Science Fair Research Question
How does the temperature of water affect the time taken for a fixed amount of granulated sugar to dissolve?
This is a testable scientific question because students can change one variable, measure a numerical outcome, and repeat the experiment.
Hypothesis
Example hypothesis:If the temperature of the water increases, then the sugar will dissolve in less time because the water molecules move more rapidly at higher temperatures, helping sugar molecules separate from the crystal surface and disperse through the water.
A hypothesis is a prediction, not a guaranteed result. Your actual observations may differ depending on the temperature, stirring consistency, and experimental conditions.
Materials Required
- Three identical heat-safe, transparent cups
- Granulated white sugar
- Measuring cup
- Measuring spoon
- Thermometer suitable for measuring water temperature
- Timer or stopwatch
- Three identical stirring spoons
- Cold water, room-temperature water, and warm water
- Notebook or printed observation sheet
- Adult supervision when preparing warm water
Safety first:Use warm water at approximately 40–45°C (104–113°F), not boiling water. An adult should prepare and check the warm sample. Use stable cups on a flat surface, avoid splashing, and do not drink the experimental solutions.
Variables in the Experiment
| Variable Type | What It Means | In This Experiment |
|---|---|---|
| Independent variable | The factor deliberately changed | Water temperature |
| Dependent variable | The outcome measured | Time required for sugar to dissolve completely |
| Controlled variables | Factors kept the same | Water volume, sugar amount, cup type, sugar type, and stirring method |
Step-by-Step Sugar Dissolving Experiment
Step 1: Prepare the Water Samples
Label three identical cups as Cold, Room Temperature, and Warm.
Measure exactly 200 mL of water into each cup. Prepare approximate starting temperatures as follows:
| Cup | Target Temperature | Condition |
|---|---|---|
| A | 10°C / 50°F | Cold water |
| B | 22°C / 72°F | Room-temperature water |
| C | 40°C / 104°F | Warm water |
These temperatures are suggested starting points. Record the actual temperature measured in each cup immediately before testing.
Step 2: Measure the Sugar
Prepare three equal portions of granulated sugar, using one level measuring teaspoon per portion. For greater precision, use a digital kitchen scale to measure the same mass for every trial.
Use sugar from the same container so that crystal size and composition remain as consistent as possible.
Step 3: Test the Cold Water
- Measure and record the cold water temperature.
- Add one measured portion of sugar.
- Start the stopwatch immediately.
- Stir gently at approximately one complete circular movement per second.
- Stop the timer when no visible sugar crystals remain, checking the bottom of the cup.
- Record the dissolving time in seconds.
Step 4: Repeat With Room-Temperature Water
Repeat the same procedure using the room-temperature sample. Keep the water volume, sugar quantity, stirring rate, and observation method unchanged.
Step 5: Repeat With Warm Water
Test the warm sample using exactly the same procedure. An adult should check that the water is comfortably warm and not hot enough to cause burns.
Step 6: Complete Three Trials
Repeat the experiment three times for each temperature using fresh water and clean cups. Prepare each sample at its target temperature before beginning a new trial.
Testing each temperature multiple times helps identify unusual results and improves the reliability of your conclusion.
Accuracy tip:For a fairer comparison, use the same person to stir and time every trial. Record the temperature immediately before adding the sugar. Avoid changing the stirring speed between samples.
Science Fair Results and Observation Table
Record your actual experimental results below. Do not fill the table with predicted or invented values.
| Water Condition | Actual Temp. (°C) | Trial 1 (sec) | Trial 2 (sec) | Trial 3 (sec) | Average (sec) |
|---|---|---|---|---|---|
| Cold | ____ | ____ | ____ | ____ | ____ |
| Room Temperature | ____ | ____ | ____ | ____ | ____ |
| Warm | ____ | ____ | ____ | ____ | ____ |
How to Calculate the Average Dissolving Time
Add the three trial times for one temperature and divide by three.
Formula:Average dissolving time = (Trial 1 + Trial 2 + Trial 3) ÷ 3
For example, if three hypothetical trials took 40, 44, and 42 seconds, the average would be 42 seconds. These numbers demonstrate the calculation only; they are not experimental findings.
How to Make a Science Fair Graph
Create a scatter plot showing how dissolving time changes with water temperature.
- Horizontal axis (X): Actual water temperature in °C
- Vertical axis (Y): Average dissolving time in seconds
- Graph title: Effect of Water Temperature on Sugar Dissolving Time
- Data points: Plot one average time for each measured temperature.
If your warm water sample dissolves the sugar faster, its point should appear lower on the graph because less time was required.
Why Does Sugar Dissolve Faster in Warm Water?
Water molecules are constantly moving. As temperature increases, their average kinetic energy increases.
When sugar is added to water, water molecules interact with the sugar crystal, allowing individual sugar molecules to separate from the crystal and spread into the surrounding liquid.
In warmer water, faster molecular movement generally increases the rate at which sugar dissolves. Stirring also speeds up the process by continually bringing fresh water into contact with the sugar surface.
However, dissolving speed is different from solubility. Dissolving speed describes how quickly sugar enters the water, while solubility describes the maximum amount that can dissolve under particular conditions.
Common Mistakes That Can Affect Results
| Common Mistake | Why It Matters | How to Avoid It |
|---|---|---|
| Different sugar amounts | Changes how much sugar must dissolve | Measure equal portions |
| Unequal water volumes | Changes the experimental conditions | Use 200 mL for every trial |
| Inconsistent stirring | Changes the dissolving rate | Use a consistent stirring method |
| Incorrect temperatures | Reduces the accuracy of comparisons | Measure immediately before testing |
| Stopping the timer too early | Produces inaccurate results | Check for remaining visible crystals |
How to Write the Science Fair Conclusion
Your conclusion should explain what your measurements showed rather than simply repeating your original prediction.
Conclusion template:“The purpose of my experiment was to determine how water temperature affects sugar dissolving time. My results showed that sugar dissolved fastest at _____°C, with an average time of _____ seconds. The slowest result occurred at _____°C. These findings [supported/did not support] my hypothesis because _____. One possible source of error was _____. If I repeated this experiment, I would improve _____.”
How to Display This Project at a Science Fair
A simple three-panel science fair board can include:
- Project title and research question
- Background research and hypothesis
- Independent, dependent, and controlled variables
- Materials and experimental procedure
- Photographs of the actual experiment
- Results table and graph
- Conclusion and possible improvements
- References
Photograph your own experiment rather than using unrelated stock photos as evidence of your results.
Ideas for Extending This Experiment
After completing the basic investigation, students can explore additional research questions in separate experiments:
- Does powdered sugar dissolve faster than granulated sugar?
- Does stirring speed change how quickly sugar dissolves?
- How does water temperature affect the dissolving time of salt?
- Does the amount of sugar change the time needed to dissolve?
- How does sugar crystal size affect dissolving speed?
Change only one independent variable at a time so the results are easier to interpret.
More Science Fair Projects for Students
Explore these related resources on 1000ScienceFairProjects.com:
- 100 Science Fair Ideas for 7th Grade — project ideas for middle school students.
- Science Fair Ideas for 7th Grade — additional experimental research questions.
- Science Fair Project Ideas PDF — resources for planning school science projects.
- Easy Science Experiments for 6th–9th Graders — experiments suitable for different grade levels.
Science References and Learning Resources
Students and teachers can use these educational resources to learn more about scientific investigations and experimental design:
- Science Buddies — Science Fair Project Guide
- American Chemical Society — Chemistry Education
- Khan Academy — Science Learning Resources
Editorial note: This is an educational experiment guide. The example temperatures and procedures are suggested conditions, not a report of experiments conducted by this website. Students should record their own observations and follow their school science fair rules.
Key Takeaways
- Warmer water generally helps sugar dissolve faster.
- Water temperature is the independent variable.
- Dissolving time is the dependent variable.
- Water volume, sugar quantity, and stirring should remain consistent.
- Repeat each temperature test three times.
- Use actual measurements to create a graph and conclusion.
Best suited for: Grade 6 science fair projects, middle school chemistry investigations, and STEM classroom activities in the United States and Canada.

Pingback: Does Light Color Affect Plant Growth? Science Experiment
Pingback: 100 Science Fair Ideas for 7th Grade Students (Fun & Winning Projects)